Global Health about Respiratory Disease
Introduction
Respiratory diseases are one of the leading causes of death and disability around the world, and are also a very common disease problem in our daily lives. However, the formation of respiratory disease is determined by multiple factors. It is not only an unfortunate encounter but also a consequence jointly caused by environmental and social factors. This study focuses on the four years following the start of the pandemic from 2020 to 2024, during which people suffered large-scale infection.
This data-driven analysis explores two critical perspectives of Respiratory Disease Rate: the quality of environments in various regions and the socio-economic factors according to healthcare in each country. By addressing three key questions, it uncovers trends in the Air Quality Index (AQI), income level, and Healthcare access in different countries.
One dataset is utilized for this study. The environment-health dataset from Kaggle tracks the relationship between lots of environmental data and health outcomes across 25 countries over several years.
Questions to Answer
Who Dominates: What are the top 10 countries that have recorded the highest average Air Quality Index (AQI) during the entire 2020-2024 period, and how is this ranking distributed across their respective Region and Income Level?
How Air Quality Affects Respiratory Health: Is there a measurable linear correlation between the average Air Quality Index and the average Respiratory Disease Rate during 2020-2024?
What Protects Respiratory Health: Explore the relationship between the average healthcare access index and average respiratory disease rate in three different income level countries during 2020-2024.
Summary of Findings
Air quality “wealth gap” : Among the countries with poor air quality, the lower-middle income level countries account for the majority
Between 2020 and 2024, the average Air Quality Index (AQI) in countries such as Kenya, Egypt, India, and so on had exceeded 150, whereas in Germany, it was only 71.8, representing a gap of more than twice the average. The Air Quality Index is an indicator that shows air quality in different regions. The higher the AQI value, the worse the air quality. Kenya tops the list with a high of 160.2 AQI, representing that local residents living in Kenya have been exposed to a polluted environment for a long time, which is three times the safety standard set by the European Union.
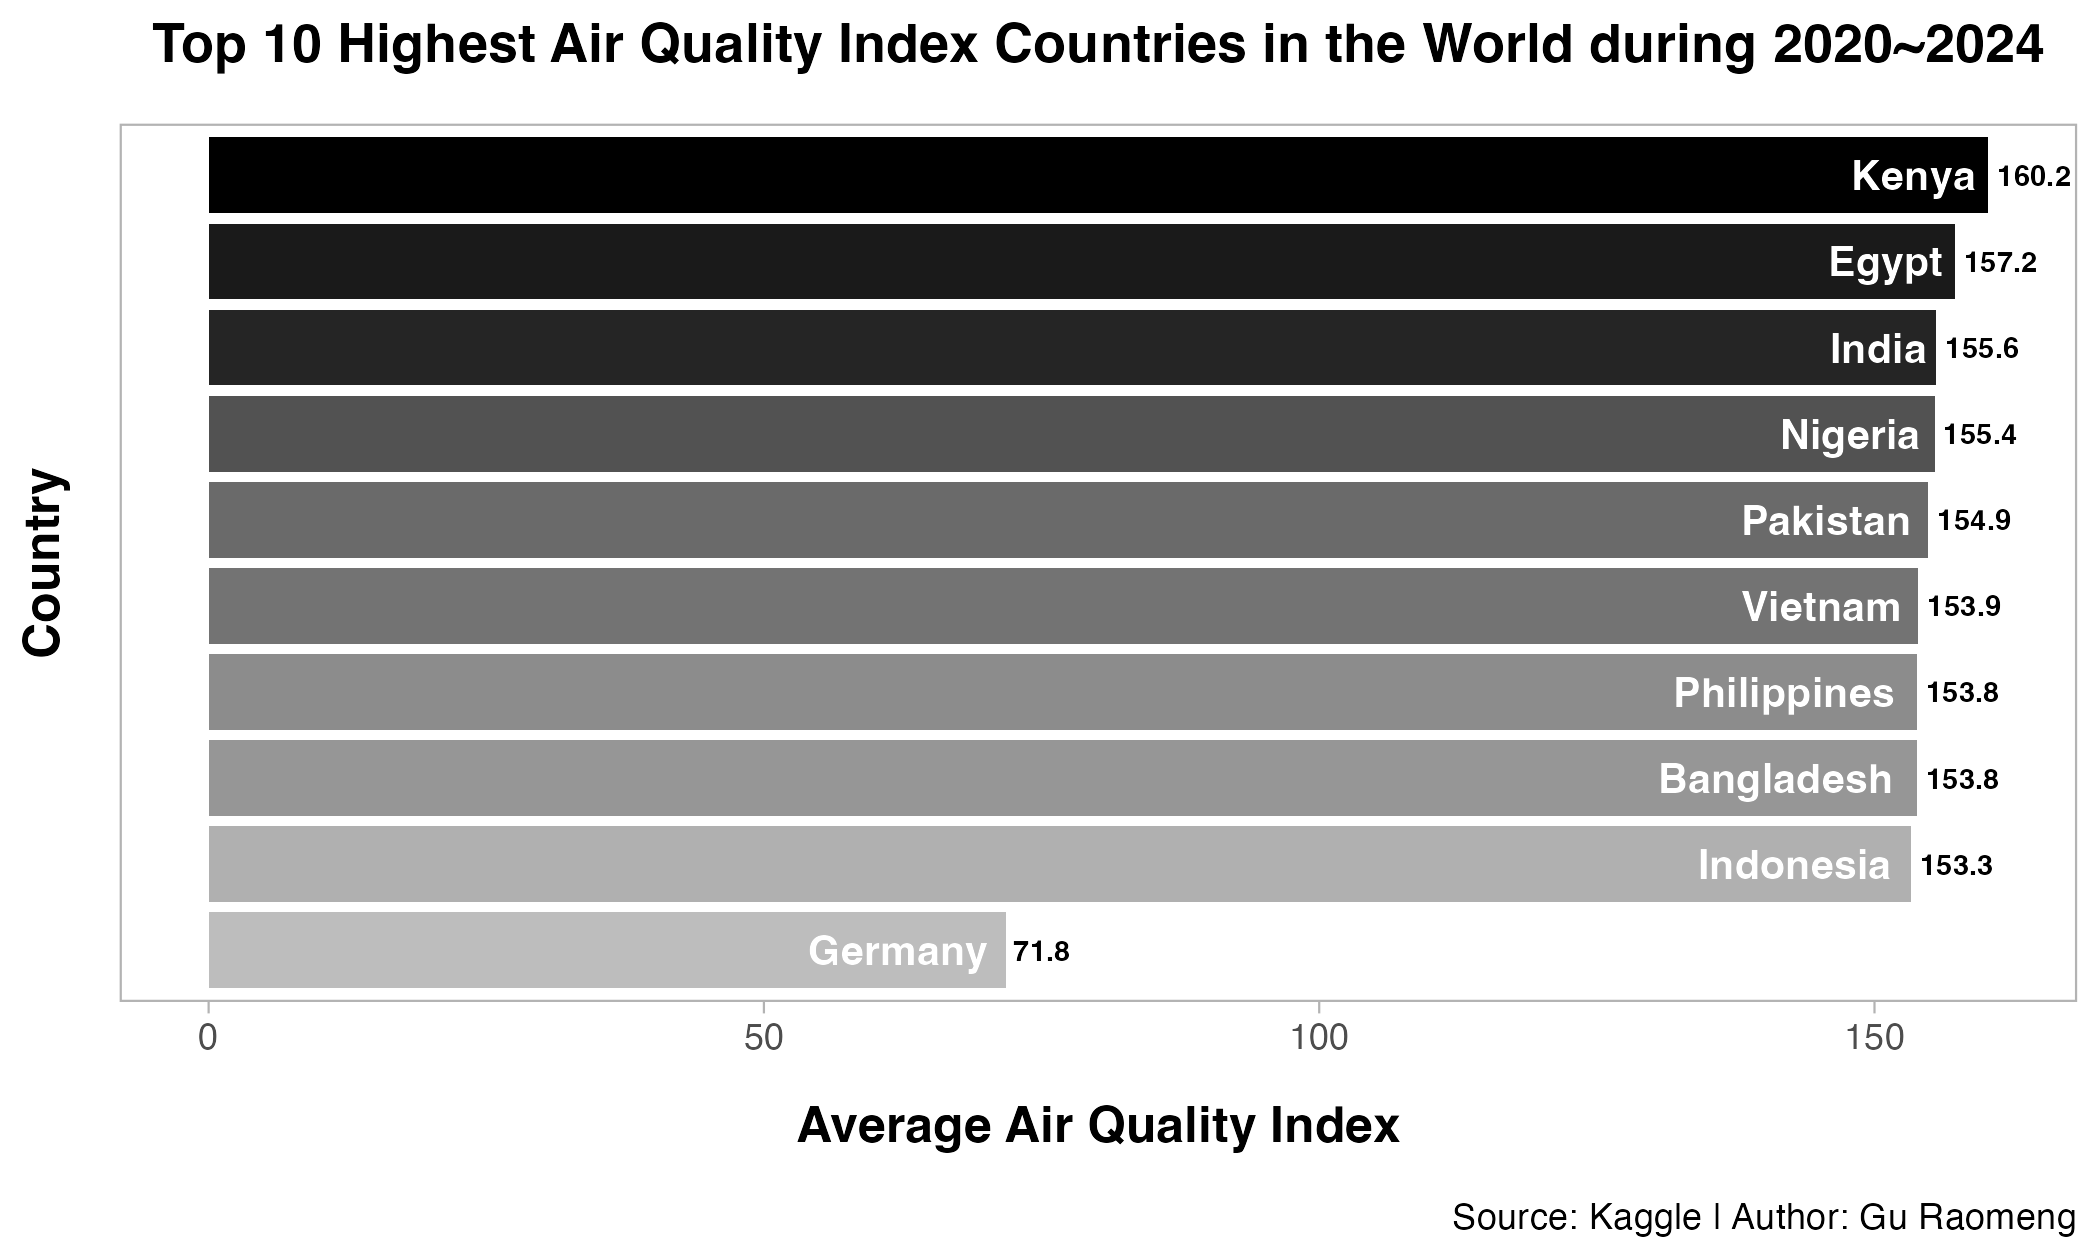
This “pollution map” clearly sketches out a dividing line - almost all highly polluted countries are located in the Global South, except for Germany, all other countries are concentrated in South Asia and Africa. Specifically, India, Indonesia, Pakistan, Bangladesh, Philippines, and Vietnam are all from South Asia. Nigeria, Kenya, and Egypt are all from Africa. The monsoon climate in South Asia and Africa will cause pollutants to remain in these regions, and the addition of the Himalayan barrier makes pollutants more difficult to spread northward. In addition, the perennial environment with relatively high temperature and humidity accelerates photochemical reactions and generates extra secondary pollutants.
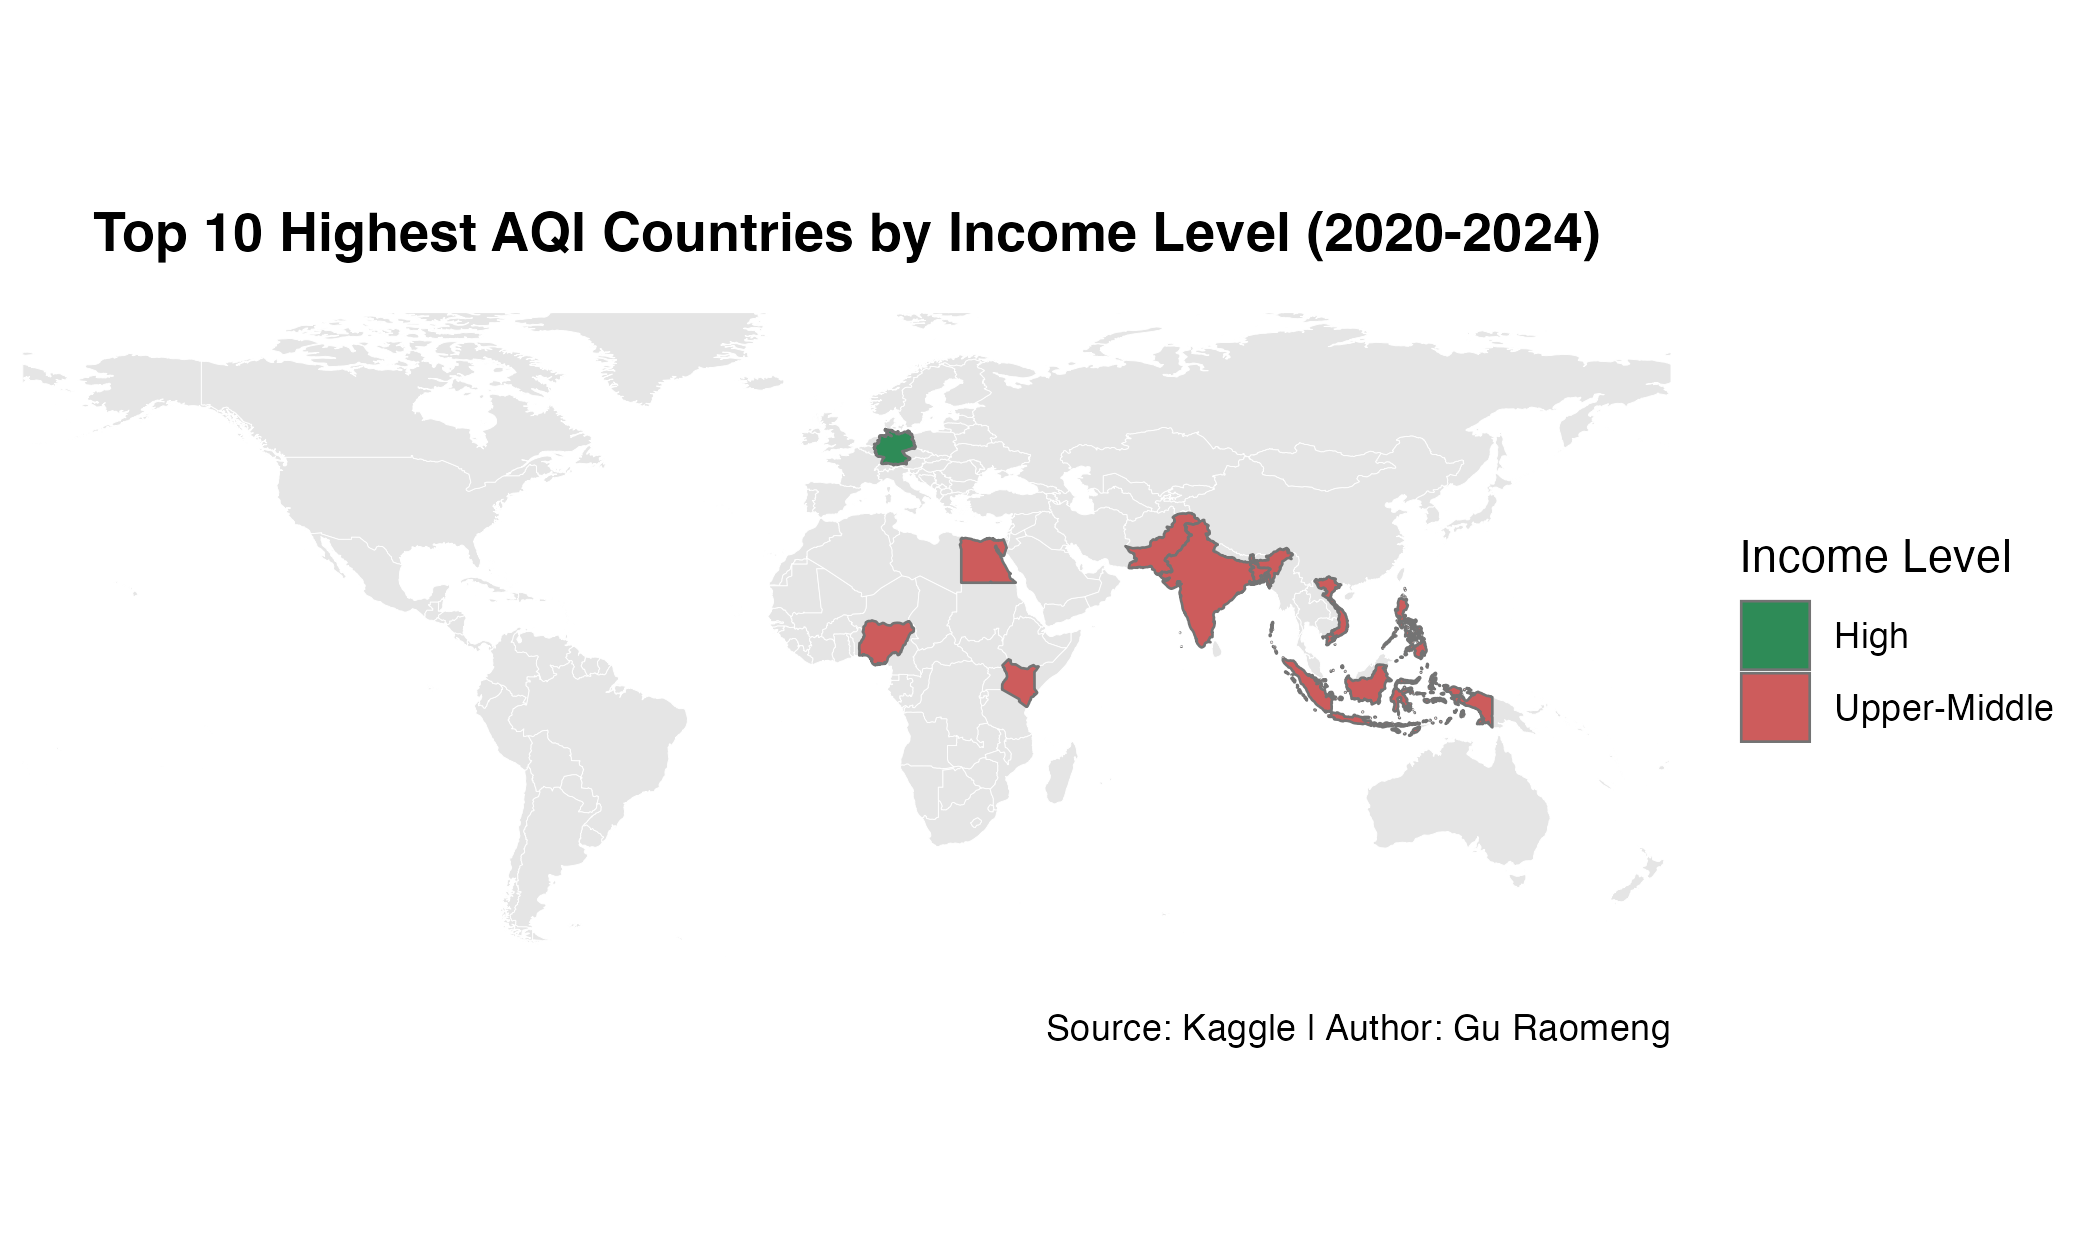
The map also shows that there are only two kinds of income level, which are high income level, Germany highlighted in green, and lower-middle income level, all the rest countries highlighted in red. These countries with lower-middle income level mainly dominant on heavily polluting industries such as manufacturing, textiles and leather due to lower-middle income level countries’ manpower is usually cheaper than other countries. This result reflects that the economic level and the degree of air pollution are closely related. Germany, a developed and high-income level country, ranks last on the list, probably due to the environmental pollution caused by its rapidly developing manufacturing industry.
Breathing Cost: Data from 25 countries around the world reveal the health ledger of air quality
A strong correlation ties air quality to respiratory disease rate, data from 25 countries between 2020 and 2024 show that the rate of respiratory diseases increases with the rise of the average air quality index (AQI), thus presenting a regressive line as shown in the graph.
The points in the Scatter plot are obviously split into two parts. In severely polluted areas, the numbers are extremely high: The average AQI in India is as high as 155.6, and its respiratory disease rate is also as high as 80.6%, which is much higher than the global average respiratory disease rate. The same in Kenya, at the very top of the plot, which has the highest AQI of 160.2 and the highest respiratory disease rate of 81.8%. The data from these two countries fully demonstrate the positive correlation between severe air pollution and a high probability of respiratory disease rates.
On the other side of the plot also approves the positive correlation between severe air pollution and respiratory disease rate. The United States has the best air quality and the lowest respiratory disease rate rather to other countries. In addition, regions such as the United Kingdom and Australia also have better air quality and better respiratory health. These countries all belong to high-income level countries, thus having better resources to treat related diseases and improve the quality of the daily living environment.
From United Stats to Kenya, the huge gap shown in Plot is not only the gap between air quality and respiratory disease rate, but also shows the huge gap in environmental protection and medical care among countries as well as geographical inequality: The top eight countries with the most severe pollution, which is the eight points in the upper right corner, all come from South Asia and Africa, while the five countries with the lowest respiratory rate are all developed countries in West. When developed countries have entered the era of high-tech development, backward countries have just begun the peak of industrial development. All these time lags have led to the current gap.
Medical Altitude: Various Income Level Reveals Healthcare’s Protective Gradient
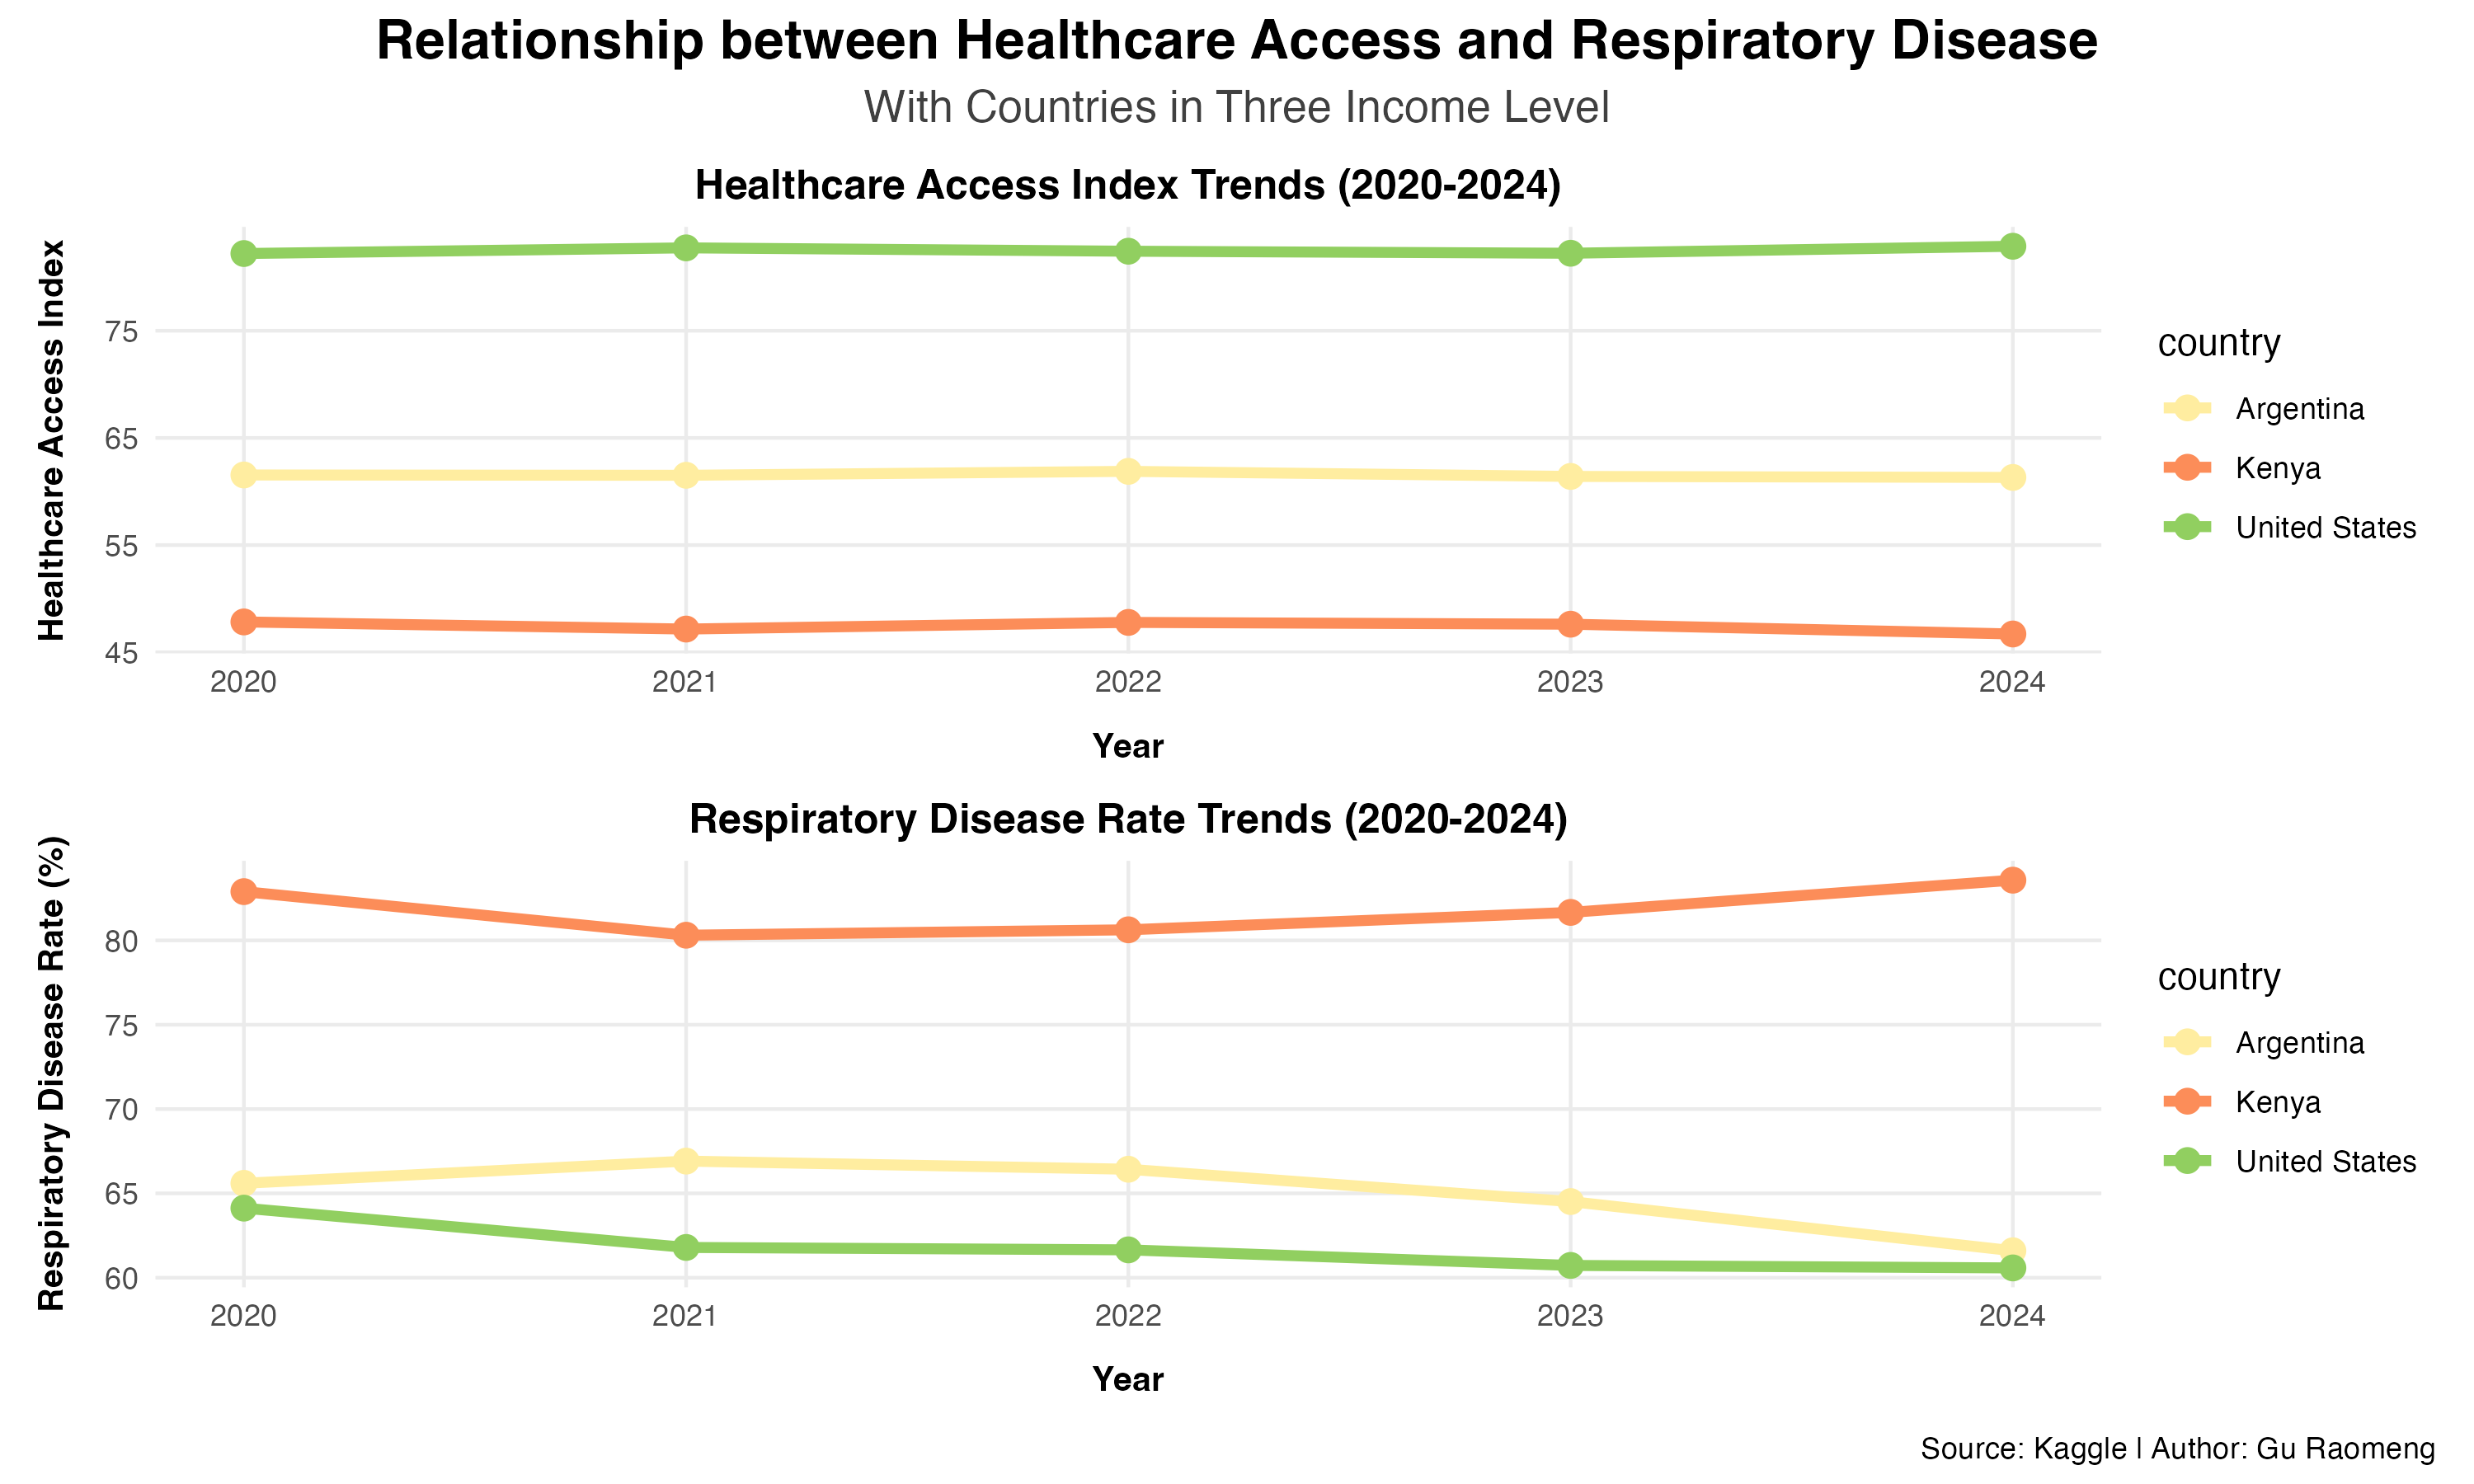
United States: High income level country
Argentina: Upper-middle income level country
Kenya: Lower-middle income level country
Judging from the first chart, the United States has a relatively high Healthcare access index, which means that people living in the United States enjoy more rights to receive medical care. Kenya has a healthcare access index approximately 40 units lower than that of the United States. This gap also reflects the degree of emphasis placed on healthcare by countries at different income levels. Argentina lies between the two countries.
The second icon shows the changes in respiratory disease rates in three countries. It is the opposite of the arrangement order presented in the first picture. Kenya is at the top of the plot, while the United States is at the bottom of the plot. This also confirms the correlation that the higher the healthcare access index, the lower the respiratory disease rate.
Furthermore, the combination of income level also well demonstrates that it is highly logical from a country’s economic strength to the utility in the medical field, and then to the level of respiratory disease rate. The higher the economic strength, the more support for healthcare that can be provided to the public, which in turn leads to a lower respiratory disease rate.
Conclusion
Respiratory Disease Rate is not merely a single health Rate. Behinds it, environmental pollution, regional differences, and uneven economic levels shows the connection. The continuous leading position of the Western economy reflects its corresponding low Air Quality Index and low Respiratory Disease Rate. The huge gap reveals the development process at different paces. From Kenya’s 160.2 AQI to Germany’s 71.8, from the United States’ 76.1 healthcare index to Argentina’s 63.4, the gaps in these figures represent technological progress, the development of The Times, and the accumulation of hundreds of years.
With the continuous development, this research results will reveal the differences in resource allocation and public health intervention among different countries, providing data support for policy-making for every country.